Inventory Advisor™
As one of the primary ingredients to any distribution company, inventory is important to understand, track, and manage. Without an accurate grasp of what inventory is costing the company and returning in revenue, the company is at risk of failing. To overcome this challenge, Dimensional Insight has created Inventory Advisor.
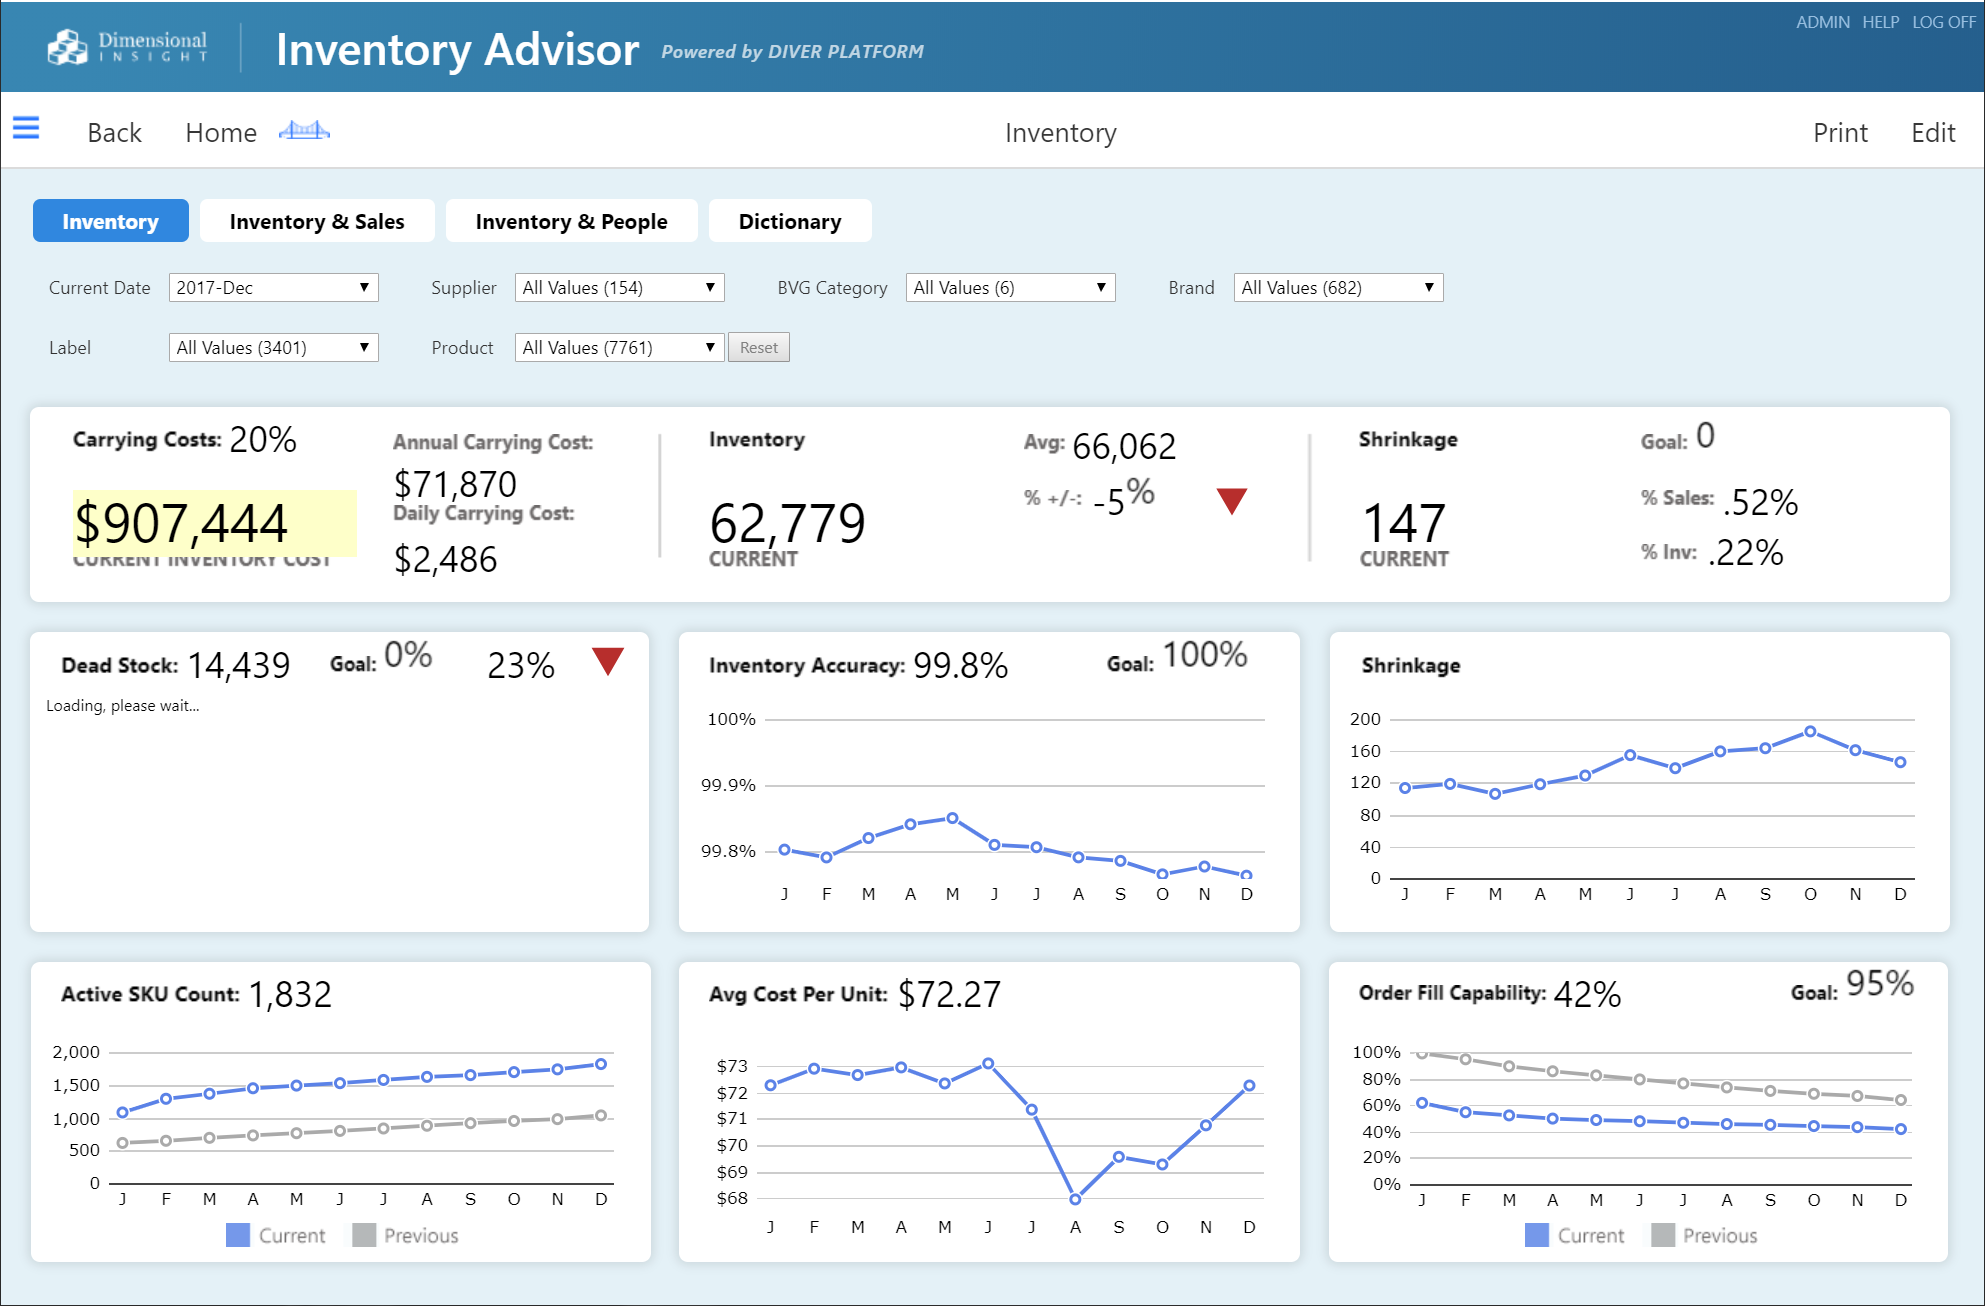
Inventory Dashboard
Inventory Carrying Costs are displayed as a percentage along with Current Inventory and include the detailed make-up of the carrying cost: lost opportunity, facility storage, service, and risk costs like shrinkage, spoilage, etc.
Shrinkage and Shrinkage Percentages are displayed as a straight number and percentage, with a graph showing value over time.
Average Cost Per Unit is displayed as a straight number with a graph showing value over time.
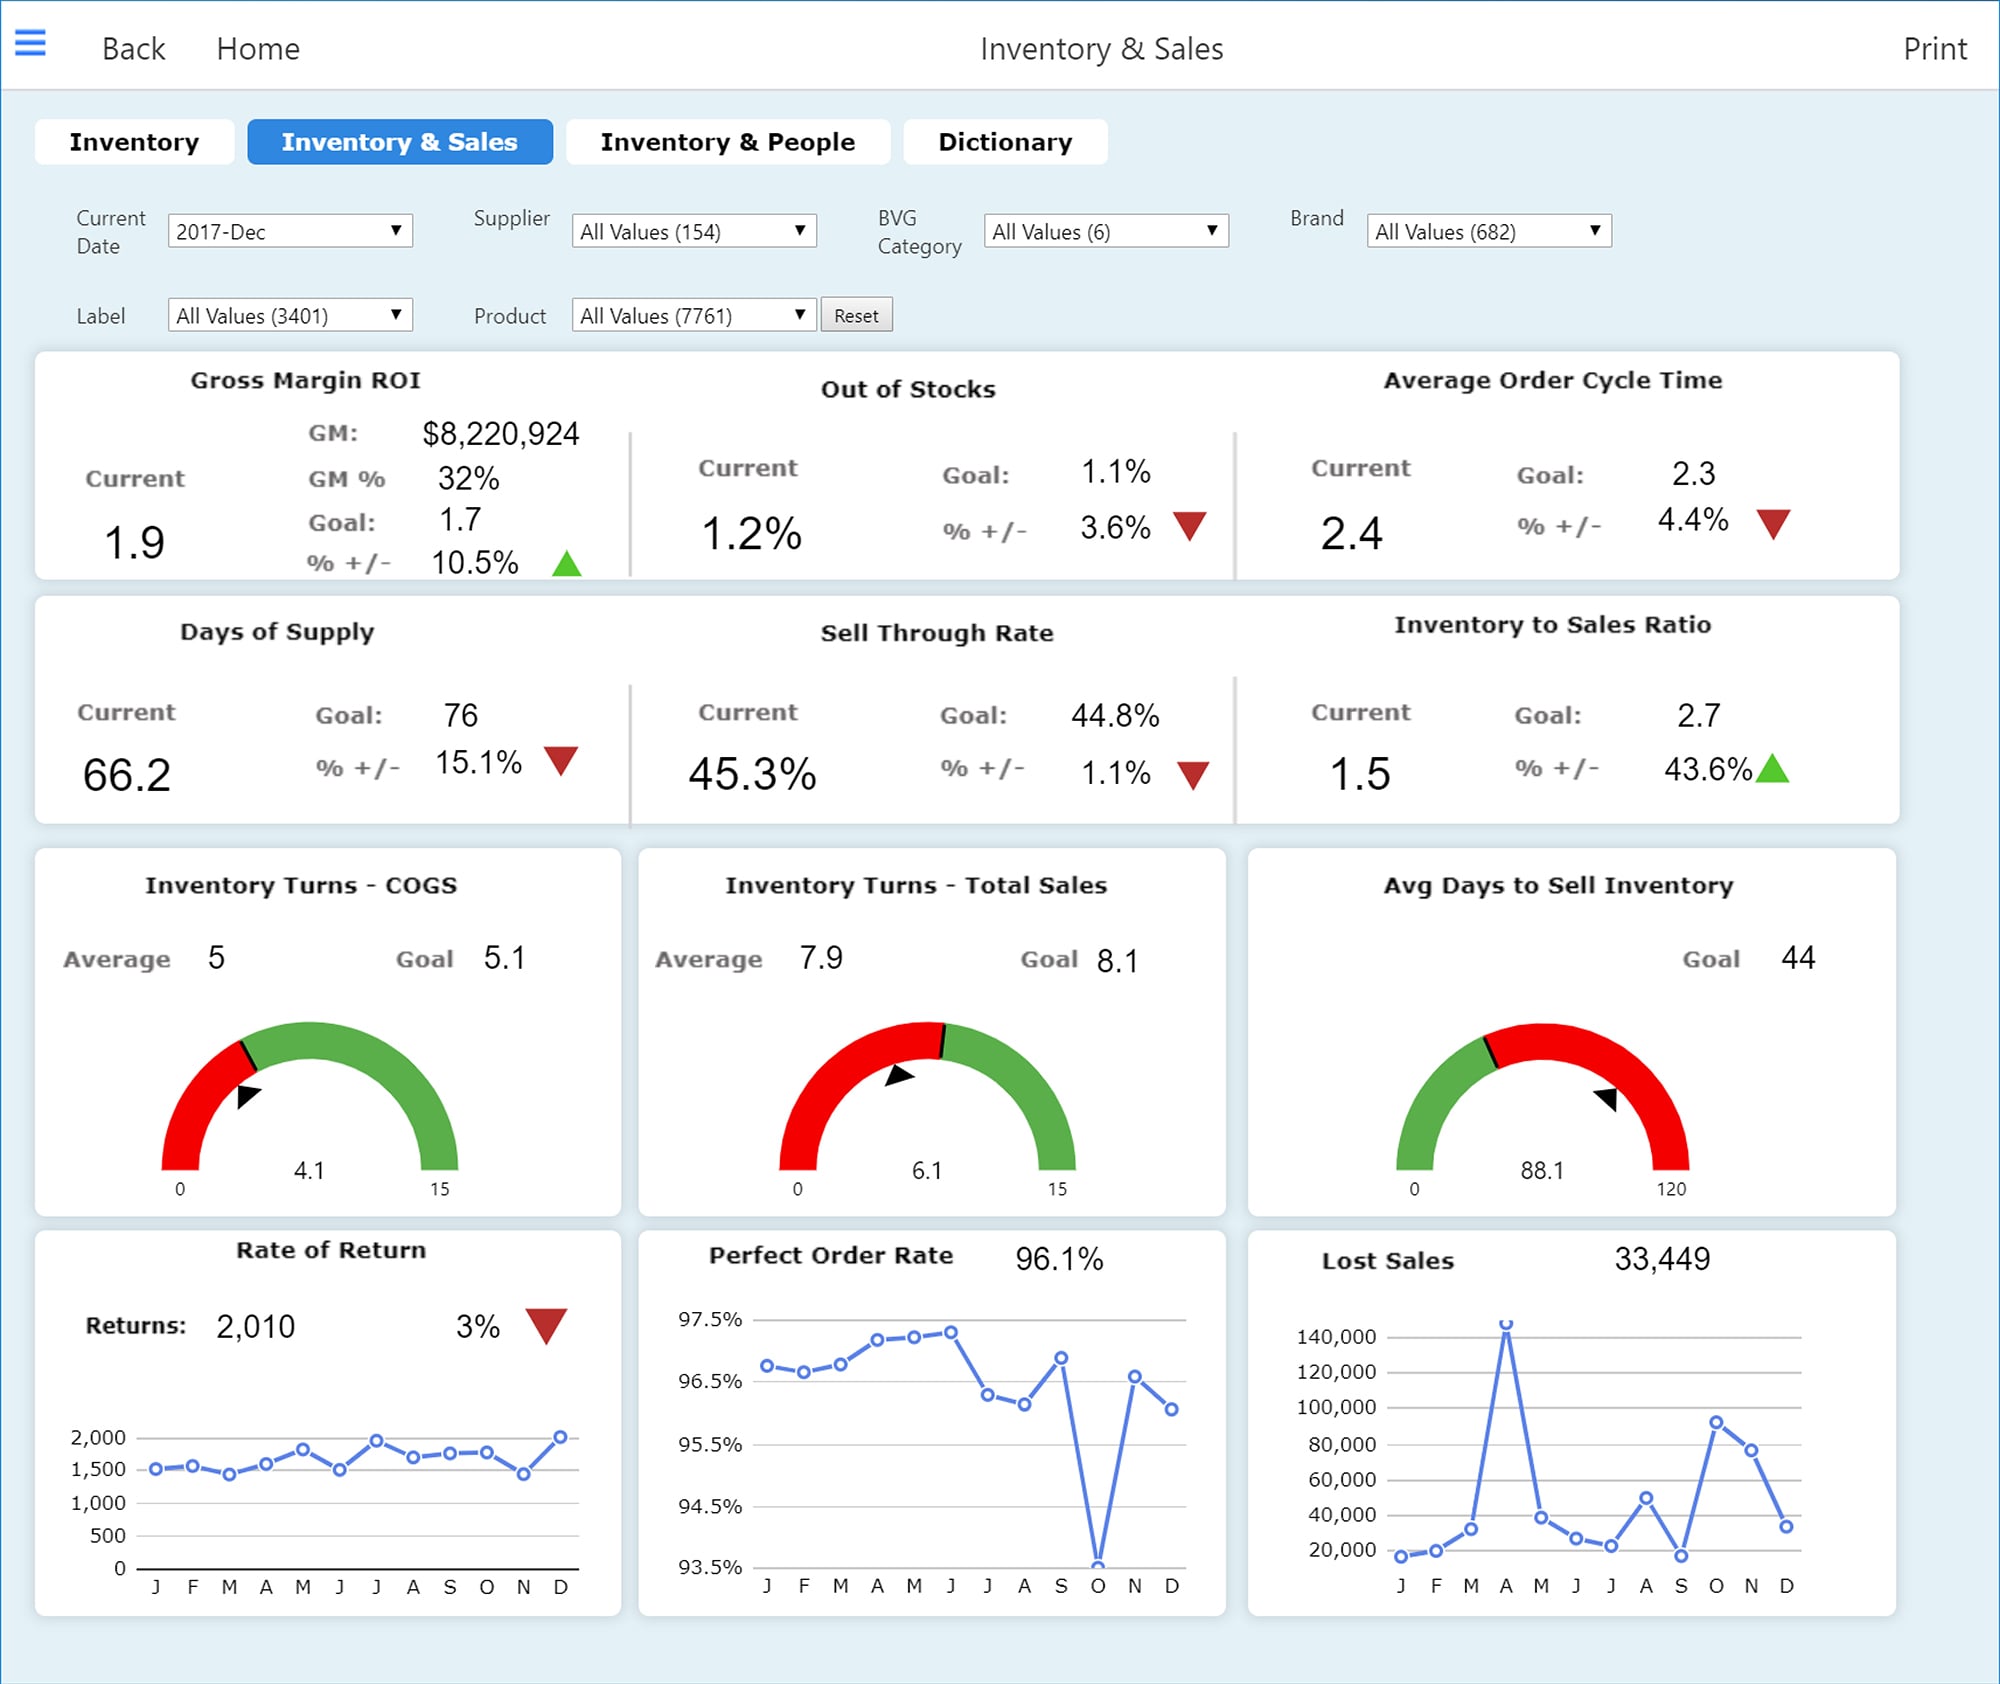
Inventory & Sales Dashboard
Gross Margin Return on Investment is an inventory profitability evaluation ratio that anlyzes the company’s ability to turn inventory into cash above the cost of the inventory.
Rate of Return shows the percentage of orders that are returned and need to be restocked. This can be configured to track why the orders were returned if the customer tracks the reasons.
Sell Through Rate is a comparison of the amount of inventory against what is actually sold.
Lost Sales shows how much money the company is losing when a product is out-of-stock.
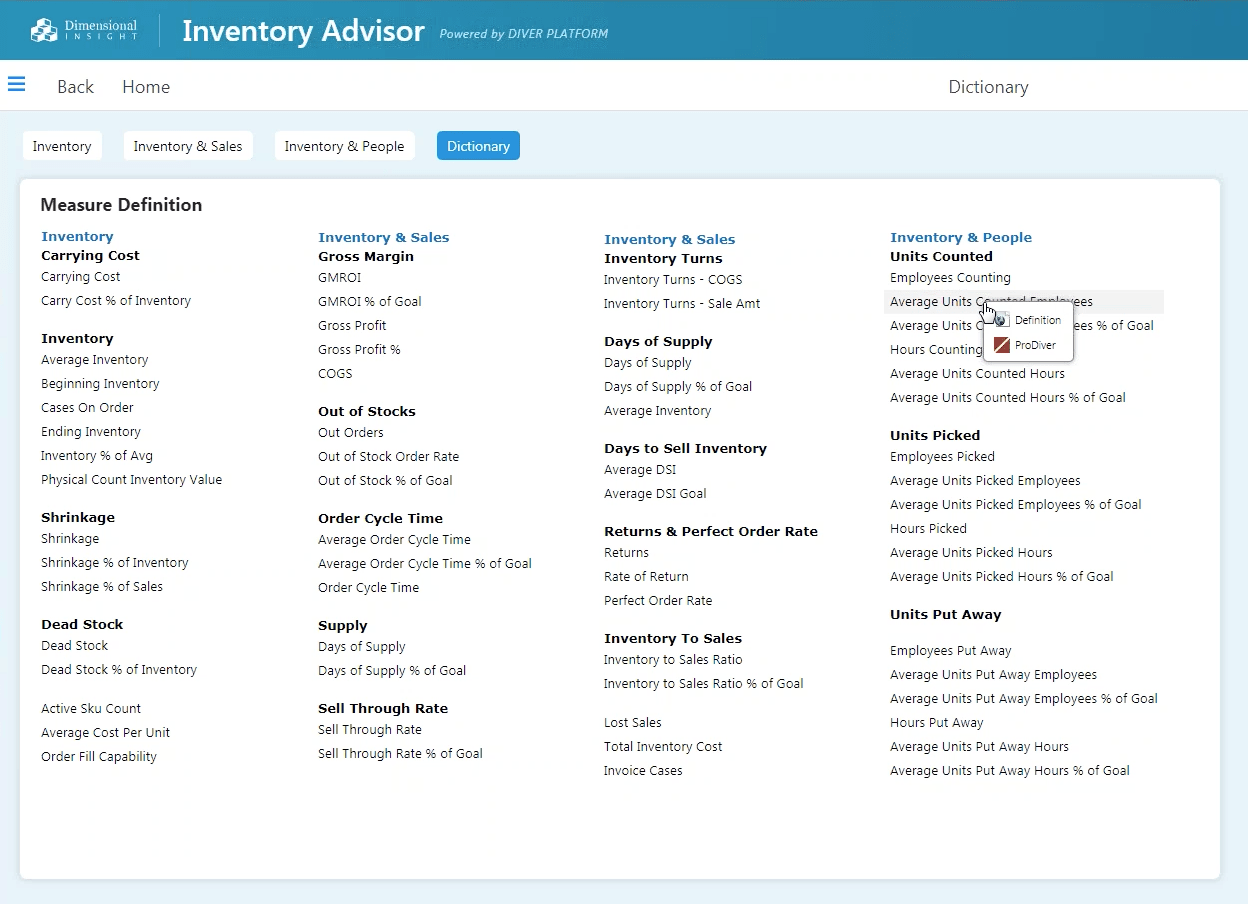
Inventory & People Dashboard
Average Units Picked is used to show how the company performed pulling and shipping products.
Average Units Put Away shows how the company performed receiving and placing product in the warehouse.